Why First/Last Mile Still Limits Fixed-Route Transit
Transit planners have understood the first/last mile problem for decades. The empirical research on walkshed radii, the models of access-egress time sensitivity, the experimental paratransit and feeder shuttle programs — the challenge is well-documented. What's changed in the last several years is the data. Docked and dockless bike-share systems, e-scooter programs, and micro-mobility operators publishing GBFS feeds have created a new stream of observable, fine-grained mobility data that, fused correctly with transit ridership data, lets planners directly measure where the first/last mile gap is — not just model it theoretically.
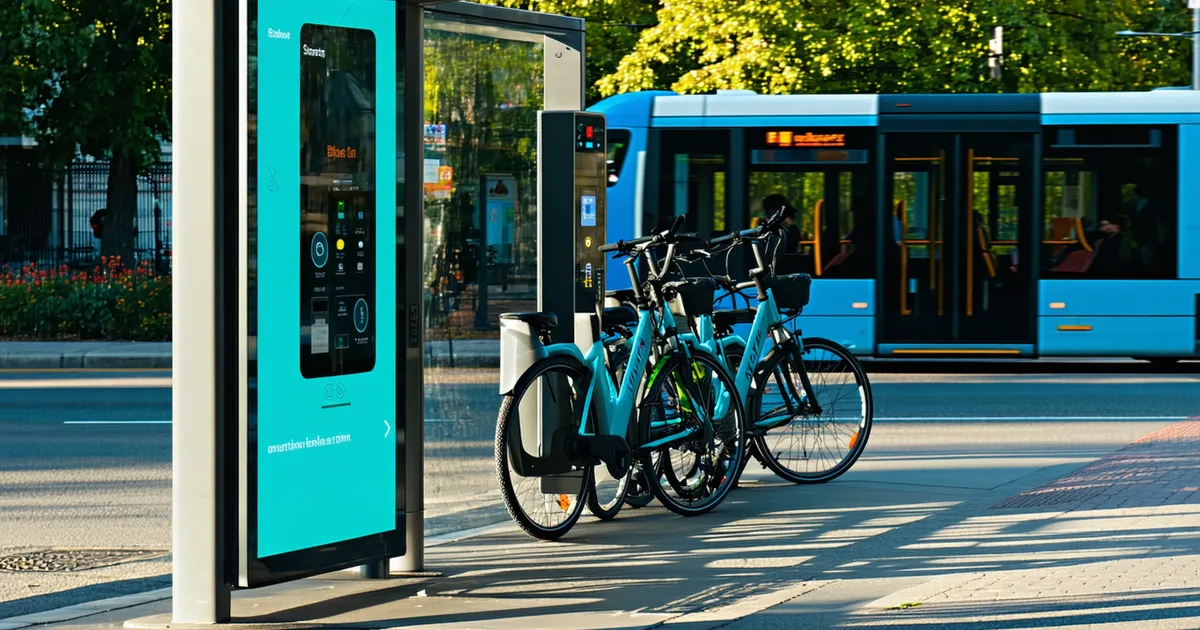
The General Bikeshare Feed Specification (GBFS) is an open standard developed and maintained by the Mobility Data organization (formerly NABSA). It covers both docked and dockless bike-share and e-scooter systems, providing station locations, real-time availability, trip records (where trip data is shared), and free-floating vehicle positions. The data is typically published by operators in compliance with municipal permit requirements, which means most cities with active bike-share or scooter programs have a GBFS feed available.
What GBFS Data Contains and Doesn't Contain
Before describing the analytical approach, it's important to be precise about what GBFS provides and where its limitations are. The feed includes:
- Station-level dock/bike availability (for docked systems): updated in real-time, typically every 30–60 seconds. Historical records must be archived by ingesting the feed periodically.
- Vehicle positions (for dockless systems): GPS location of each available vehicle, updated frequently. For dockless systems, this is the primary demand signal — where vehicles are concentrated tells you something about where riders are ending trips.
- Trip records (where shared by operators): origin station/location, destination station/location, trip duration, start and end timestamps. Trip records are the most analytically valuable component, but they're also the least consistently available — many operators share trip data only in anonymized, delayed form, or only under data-sharing agreements negotiated separately from the GBFS feed.
What GBFS does not typically contain: individual rider demographics, payment method, or information about what the rider did before or after the bike-share trip. This means you can observe the micro-mobility trip itself, but you cannot directly observe whether it connected to a transit trip without additional data fusion.
The Fusion Approach: Connecting GBFS to Transit Demand
The analytical insight that makes GBFS useful for first/last mile analysis is temporal-spatial coincidence: a bike-share trip that ends within a defined walkshed of a transit stop, within a time window consistent with a transfer, is a strong candidate for a first/last mile connection. The same logic applies in reverse for trips originating near transit stops.
The specific methodology involves several steps:
- Define transit stop catchment areas: Using H3 resolution 9 cells (approximately 0.1 km² each), map the walkable catchment area around each transit stop — typically a 5-minute walk isochrone derived from the pedestrian network, not a simple radius buffer. Using actual network-based catchment areas matters here: a buffer that extends across a highway or through a large parking lot significantly overestimates accessible area.
- Identify bike-share trip endpoints in catchment areas: For each transit stop, flag all bike-share trip end points (for trips approaching the stop) and start points (for trips departing from the stop) that fall within the catchment area. Filter by time window: a bike-share trip arriving at a stop catchment within 20 minutes before a scheduled transit departure is a candidate first-mile connection; a trip departing within 20 minutes after a scheduled arrival is a candidate last-mile connection.
- Calculate transfer connection rate by stop: For each stop, the ratio of candidate first/last mile bike-share trips to observed transit boardings/alightings gives you an indicator of multimodal connection intensity. Stops with high candidate connection rates relative to ridership are already functioning as multimodal nodes; stops with high ridership but low connection rates are potential targets for improved micro-mobility infrastructure.
- Map the gap: Stops and H3 cells with high latent demand (based on surrounding land use, employment density, and demographic data) but low transit ridership and low bike-share connectivity are the first/last mile gap — places where people need to travel but the combination of transit and micro-mobility isn't currently making the connection.
A Scenario: Gap Analysis at a Suburban Employment Corridor
Consider a suburban employment corridor served by a commuter express route that drops riders at a stop roughly 0.8 miles from the primary employment cluster. The corridor has reasonably strong inbound peak ridership — workers who tolerate the walk because they have no alternative. Outbound ridership in the off-peak is noticeably lower, suggesting that workers who have flexible schedules or access to a car are driving rather than using transit for the reverse trip.
A GBFS analysis of the bike-share and e-scooter activity around this stop reveals a different pattern than the ridership data suggests. During the AM peak, there's substantial outbound micro-mobility activity from the stop — people arriving by transit and immediately picking up a scooter or bike to cover the remaining 0.8 miles. But that micro-mobility infrastructure is thin: only 3 docking stations, frequently depleted by 8:30 AM. The last-mile option exists but is capacity-constrained. In the PM outbound, there's almost no micro-mobility activity from the employment cluster back toward the stop — partly because the employment cluster has no scooter or bike infrastructure at all.
The gap analysis points to a specific intervention: expand docking capacity at the transit stop, and negotiate with the micro-mobility operator to include the employment cluster in the deployment zone. This is a targeted, data-supported ask — not a general "we need more bike-share" statement.
Data Freshness and Coverage Gaps
GBFS data quality varies significantly by operator and by city. The main issues to plan for:
Feed staleness: Some operators update their GBFS feeds less frequently than the specification recommends, particularly for vehicle positions. A dockless fleet with position data that's 2–4 hours stale is essentially useless for time-sensitive connection analysis. Check the last_updated field in the feed metadata to validate freshness before relying on the data.
Coverage gaps by neighborhood: Docked bike-share systems tend to have station density that mirrors income and land value — higher coverage in central business districts and wealthier neighborhoods, sparse or absent coverage in lower-income areas. This means GBFS-based first/last mile analysis will have less data to work with in the neighborhoods where first/last mile gaps are often most severe. This isn't an argument against using GBFS data; it's an argument for pairing the analysis with pedestrian accessibility modeling to surface gaps in areas where micro-mobility data is sparse.
We're not saying GBFS trip data can substitute for a comprehensive multimodal travel survey. It can't — it captures only a specific mode under specific conditions. What it can do is give transit planners a high-resolution, continuously-updated view of where micro-mobility is and isn't facilitating transit connections, at a fraction of the cost and delay of a periodic travel survey.
Using the Analysis for Infrastructure Investment Decisions
The output of a GBFS-transit fusion analysis is most useful when translated directly into infrastructure and programmatic recommendations. Planners should expect to produce outputs in three categories:
- Station placement recommendations: Specific H3 cells where micro-mobility station density should increase to serve identified transit connection demand.
- Rebalancing priority flags: High-connection stops where bike-share availability consistently depletes during peak windows, indicating that operator rebalancing schedules need adjustment.
- Service design inputs: Stops where first/last mile gaps are too large for micro-mobility to bridge even with improved infrastructure — pointing toward shuttle service, route alignment modifications, or TOD-oriented land use conversations with the planning department.
Transit agencies that have been part of bike-share governance boards or data-sharing agreements with micro-mobility operators are already positioned to act on these findings. For agencies that don't yet have those relationships, the data-driven case for a formal data-sharing agreement with micro-mobility operators — grounding the ask in specific infrastructure gaps and connection demand estimates — is more compelling than a general request for data access.