Writing on robotics, warehouses, and the software between them.

2025 in Review: What We Shipped and What We Learned
A look back at the obstacle classes we added, the edge cases we hit in cold storage, and the integrations that took longer than planned.
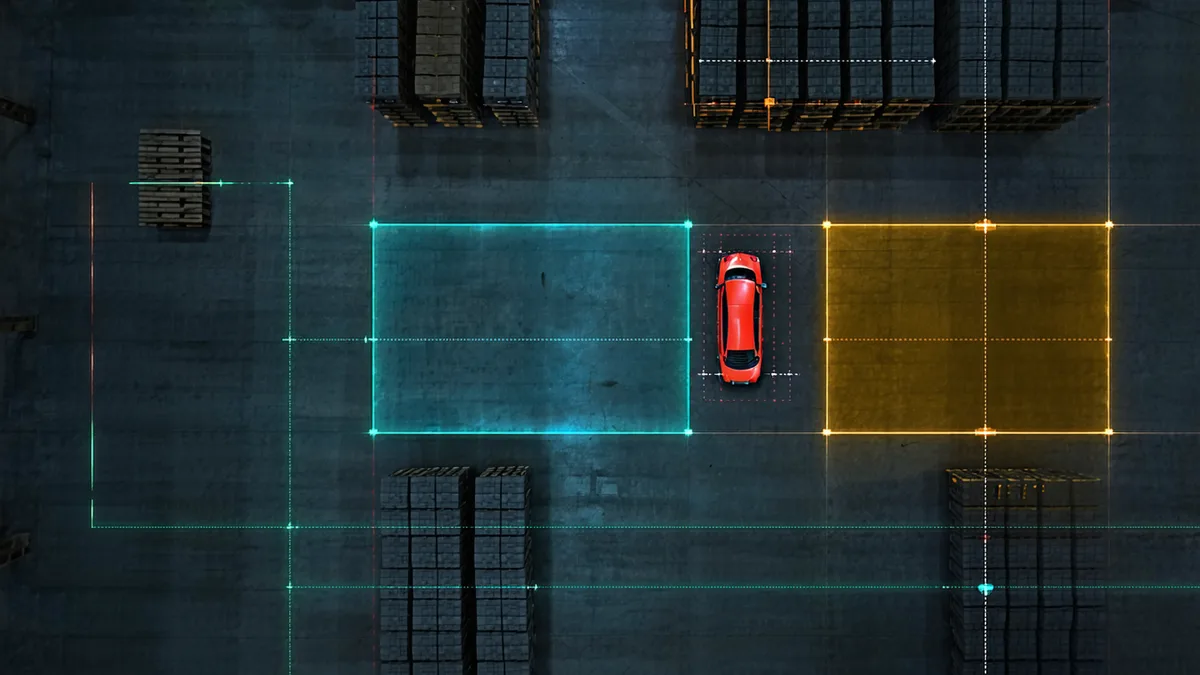
Obstacle Classification: When Unknown Object Is Not Good Enough
Why "unknown-moving" and "unknown-static" aren't failures — and what you lose when a system treats every unrecognized shape the same way.

Integrating AMR Software with WMS: Four Patterns We Have Seen Work
REST push, MQTT event, file polling, and hybrid — each has a real use case depending on your WMS architecture and latency requirements.

Testing AMR Perception Software Without a Physical Warehouse
How we use ROS 2 bag files, Gazebo scenarios, and recorded LiDAR datasets to run regression tests without booking floor time.

Dynamic Re-Routing vs Static Path Fallback in Busy Aisles
Static fallback paths look safe on paper. In practice they create predictable congestion. Here's what dynamic re-routing costs and what it buys.

Pick-Slot Timing Windows: The Real Constraint on AMR Throughput
Most path planners optimize for distance. Warehouse operations optimize for arrival time. The gap between those two objectives is where throughput disappears.
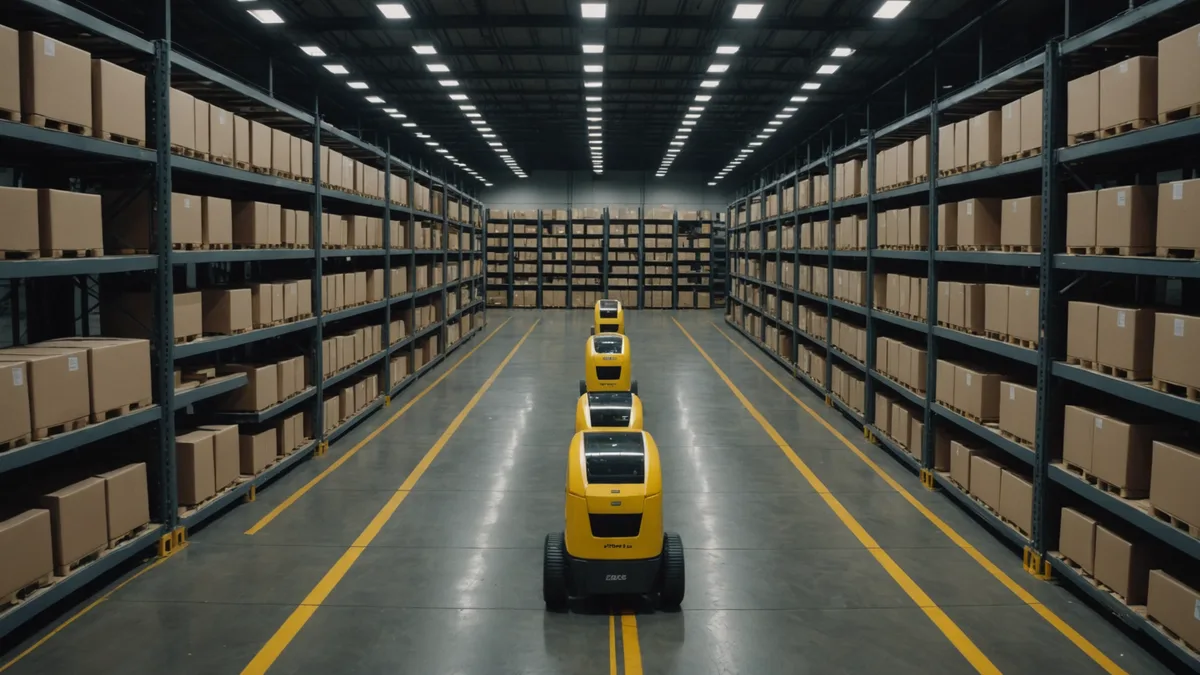
AMR Fleet Coordination Without a Centralized Planner
Centralized fleet planning works until it doesn't. We share obstacle event data at the edge instead — here's why that's often enough.
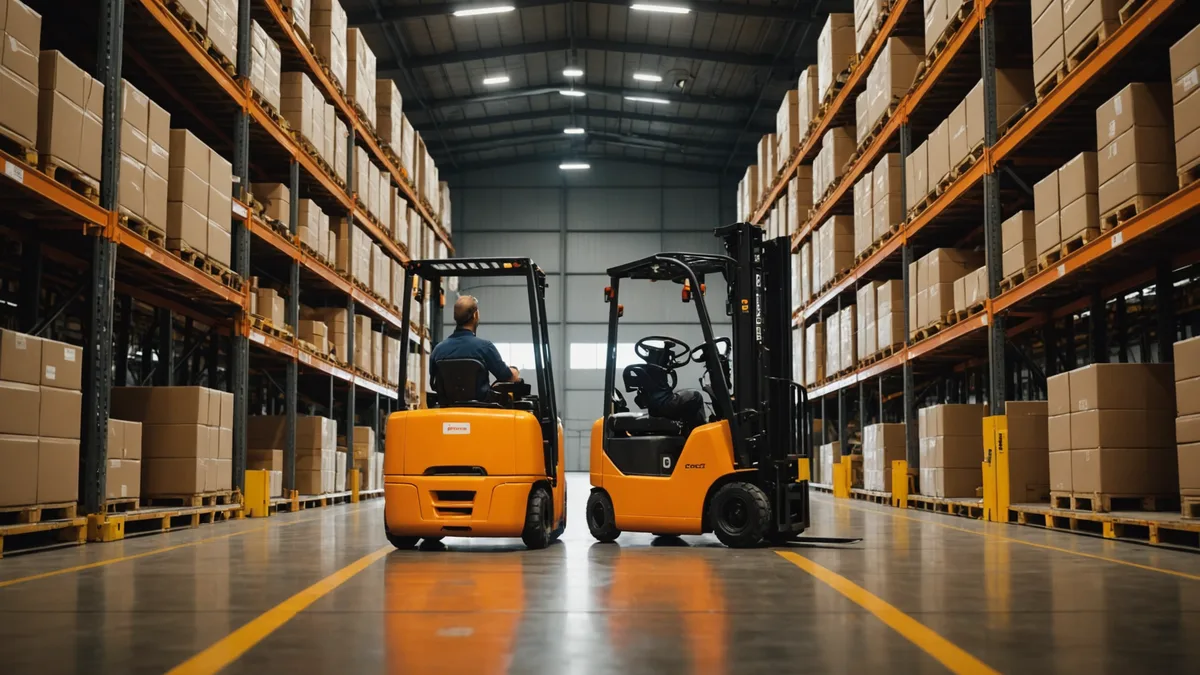
How We Detect a Reversing Forklift in Under 80ms
A reversing forklift has a different LiDAR signature than a forward-moving one. This post walks through the classification pipeline for one of our hardest obstacle classes.
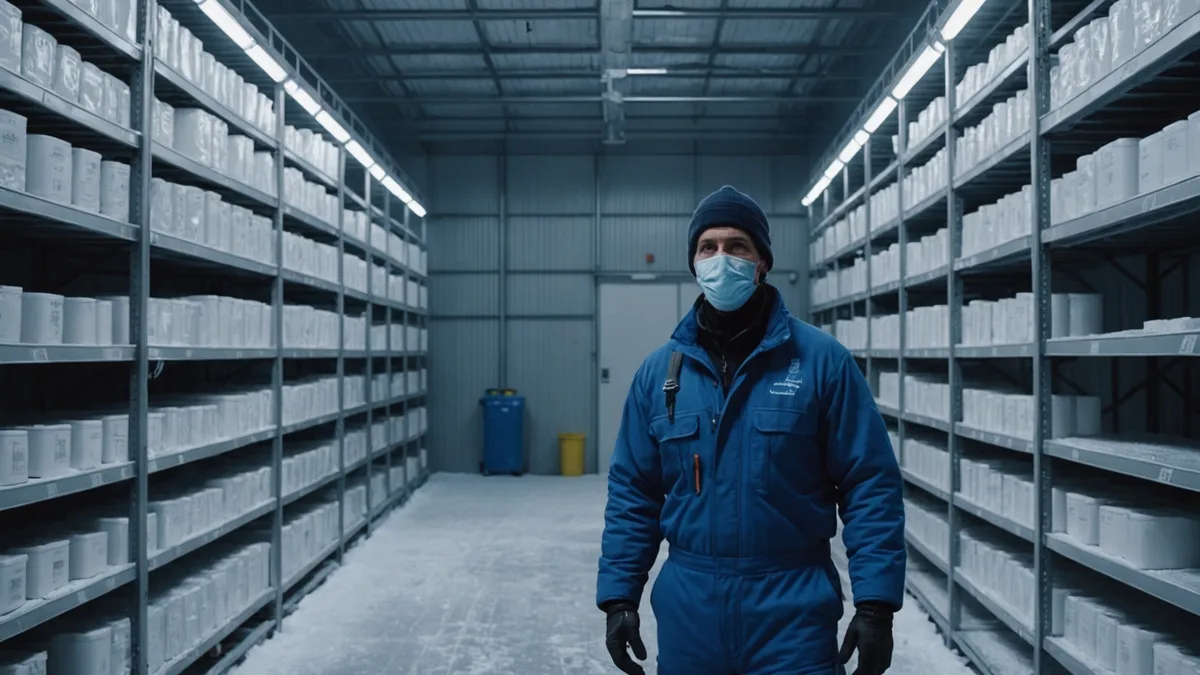
Cold Storage Robotics: Why Temperature Changes Break Your Maps
A map built at ambient temperature is wrong at -20°C. Thermal expansion, fog artifacts, and PPE-changed human signatures all compound the problem.

ROS 2 Nav2: What It Does Well and Where It Falls Short
Nav2 is mature and well-maintained. It's also built around static costmaps. Here's where the architecture works and where you need to add a dynamic layer.
The Hidden Cost of Pre-Mapped Facility Grids
The remap cycle isn't free. When every layout change means a shift of downtime, you're paying a tax every time the floor changes — which in most facilities is constantly.
LiDAR vs Stereo Vision for AMR Obstacle Detection
Both sensors work. The right choice depends on your environment, budget, and what failure modes you can tolerate. A direct comparison from field experience.

Why Warehouse Robots Keep Getting Lost
The answer almost always traces to the same root cause: a map that describes a facility that no longer exists. Here's why static maps fail and what the fix looks like.